
About BryteFlow Control Room
BryteFlow Control Room is a one point monitoring application for BryteFlow. It is a companion product to BryteFlow Ingest and Bryteflow Blend, it can seamlessly collect the status of Blend and Ingest pipelines. And, used for monitoring and alerting from one common control point for all different pipelines.
Prerequisite
The following are minimum requirements for BryteFlow Control Room
- A physical or virtual machine running Windows server-level operating system.
- Java version 8 is required to be installed on the machine.
- In an AWS environment, Connectivity and permissions to access AWS Cloudwatch Log.
- BryteFlow Control Room on AWS, uses AWS access key and secret key to read AWS Cloudwatch logs.
- Port 8091 needs to be available on the system for the application to bind to.
- Open access to Port 8091 through any firewalls for interface access.
- Google Chrome
Installation
The application can be placed in any folder, however Bryte recommends installing to the following location:
c:\bryteflow\controlroom\
Step 1 – Application Files
Unzip the application archive to your desired folder, for example
c:\bryteflow\controlroom\
Step 2 – Run the Application
- In order to install the service open windows command prompt with ‘Run as Administrator’
- Change the directory to the path of ‘controlroom’
- Execute ‘Install-BryteFlow controlroom Service.bat’
- ‘BryteFlow Controlroom’ service is now installed on the server.
- Go to Windows ‘services’ and start the service for Ingest.
- Launch the user interface from google chrome browser
Step 3 – Access the User Interface
BryteFlow Control Room utilizes a browser-based user interface. You can access this, once the application is running, on:
If you are accessing remotely then use the appropriate domain and port 8091.
Dashboard
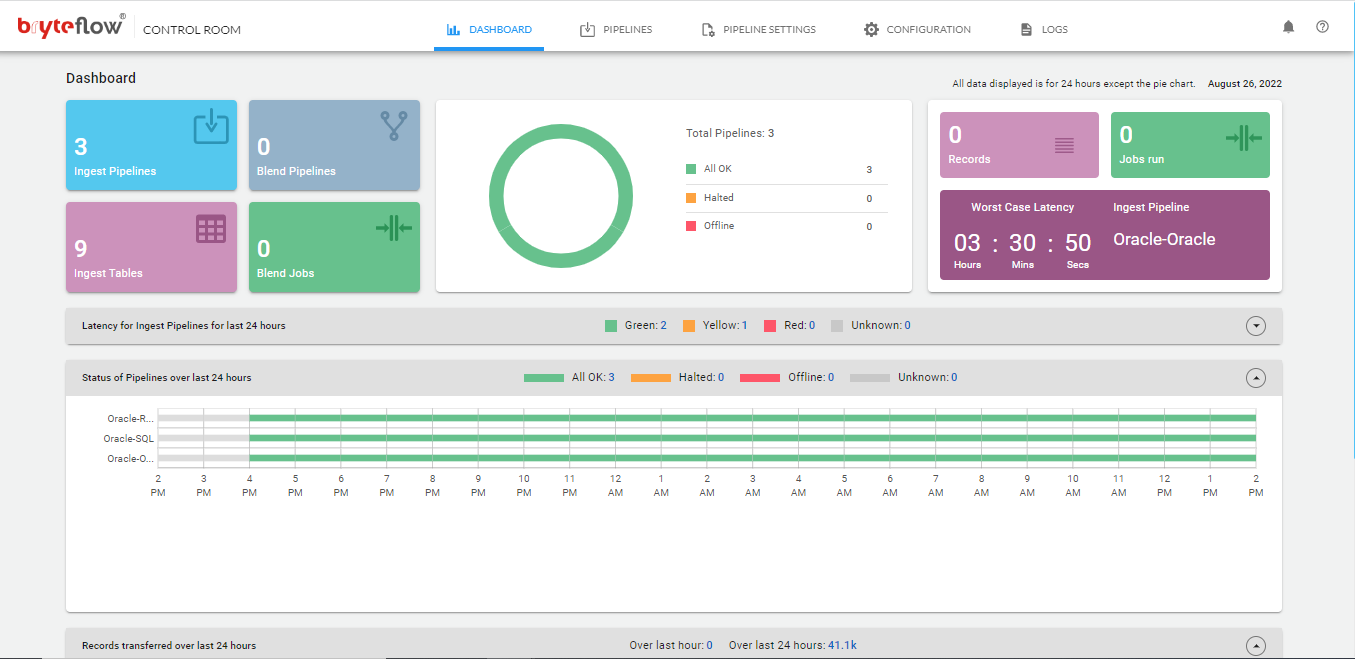
- The dashboard displays the number of Ingest and Blend pipelines configured in the Data Dashboard along with the number of tables in Ingest, XL Ingest, Trudata and Jobs in Blend.
- On the right side, the total number of records process, and in case of Blend total number of jobs executed in the last 24 hours are displayed.
- The worst-case latency for Ingest pipeline is displayed. The time since the last successful extract is also displayed.
- The lower part of the page is a graphical representation of the latency of each Ingest pipeline. The color indicates the latency with respect to the two defined thresholds for each pipeline.
- Hovering over the box will display the latency for that time period along with its value compared to the two thresholds.
Pipelines
The Control Room “Pipelines” tab displays all configured pipelines with all the detailed information, all in one place.
The attributes carrying information is configurable as per Users preference. Following information is available to be displayed for each pipeline:
- Pipeline Name
- Open UI
- Status
- Extract
- Load
- Latency
- Last Extract
- Last Load
- Version
- Expiry
- Disk Free
- Memory Free
- Prev Extract
- Prev Load and a few more.
These can be selected to be displayed or not to be displayed by customizing it on clicking the Settings icon in the right corner.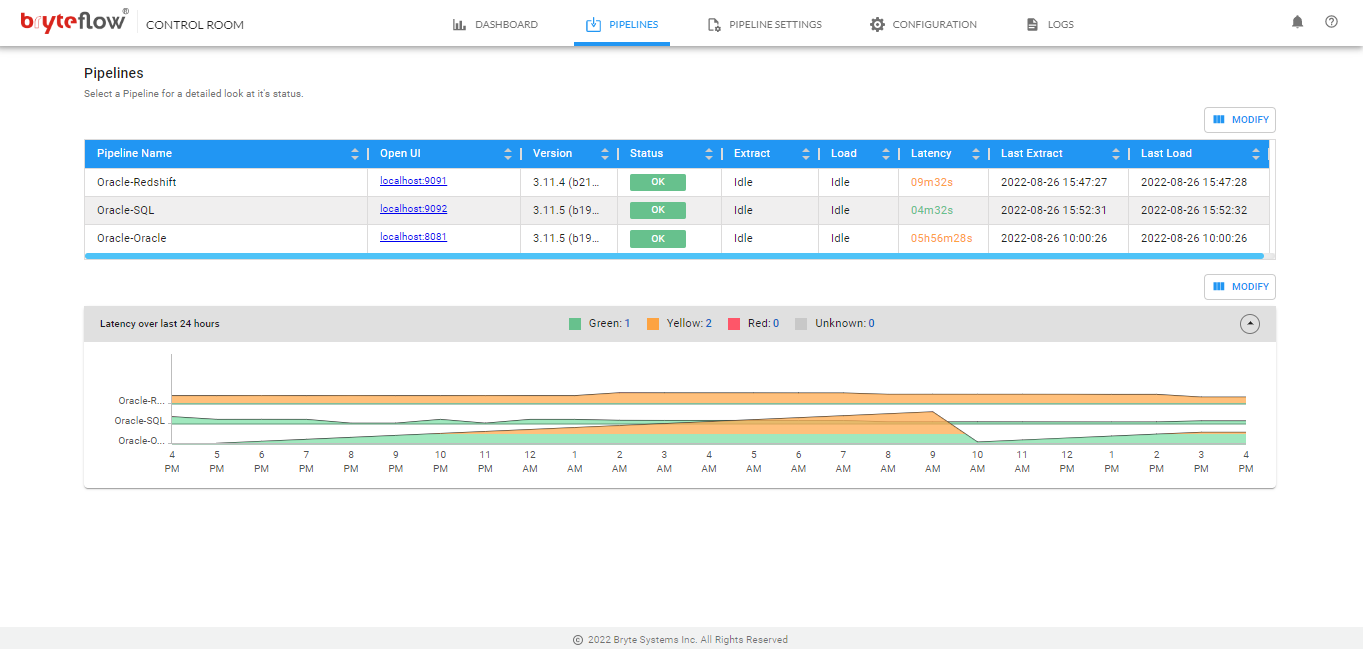
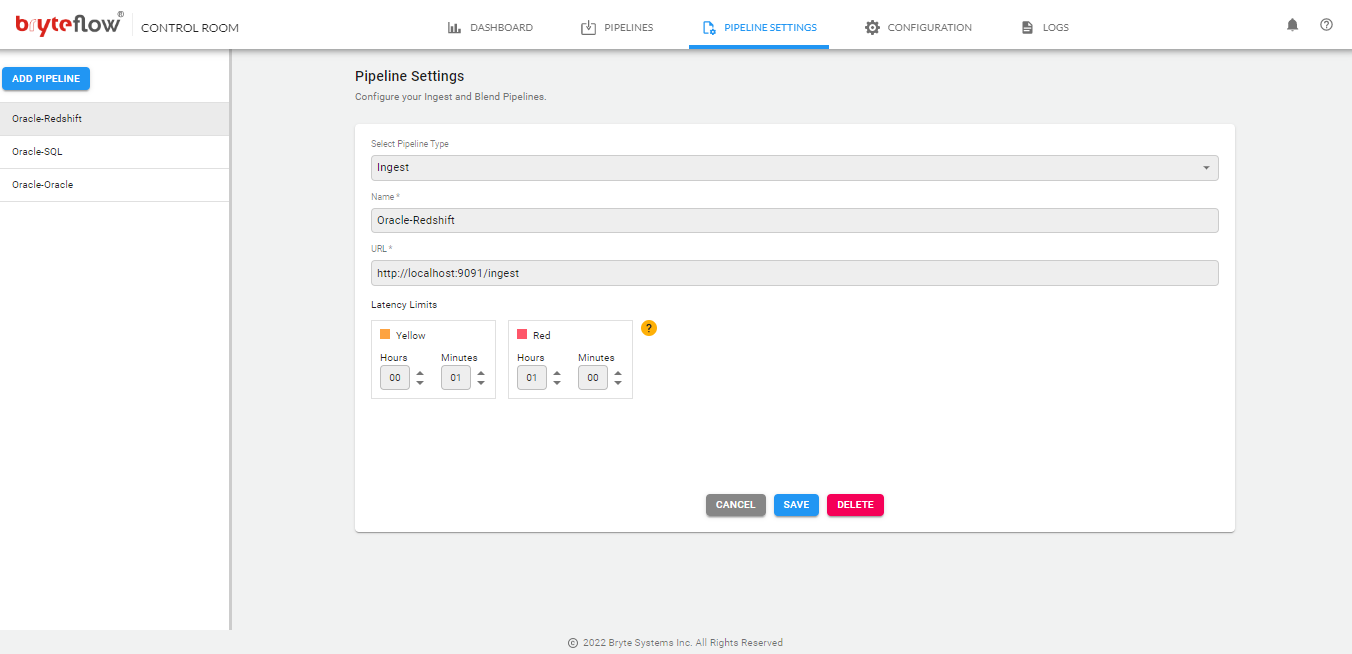
Pipeline Settings
In Pipeline Settings, we can add an Ingest, XL Ingest, Trudata or Blend pipelines to be monitored in the Control Room.
Add Pipeline
Add new Pipelines in Control Room:
- Go to ‘Pipeline Settings’
- Click on ‘Add Pipeline’
- Chose appropriate ‘Pipeline Type’ from the drop down list. If your Ingest version is lower than 3.10 then, you need to select Ingest (Old) from the dropdown. Specify the URI of the Ingest Pipeline which you want to monitor. e.g. http://192.168.10.51:8081
- When setting it up for Azure environment, please select Pipeline type as ‘Ingest (Old)’
- Provide a relevant name in the ‘Name’ section
- Provide Ingest URL in the ‘URL’
- Specify Latency limits for Amber and Red zones. There are two latency thresholds set here. For latency values less than the first threshold as show as green on the dashboard, between the first and second thresholds as yellow and over the second threshold as red. Set the two latency thresholds (Amber and red).
- Hit ‘Save’. The Ingest Pipeline will appear under ‘Ingest Pipeline’ tab and Blend pipeline will appear under ‘Blend Pipeline’ tab.
- To add more pipelines, repeat steps 1-8.
Configuration
Control Room Configuration section is to setup Security, Alerts and Credentials.
Security
In the ‘Security’ section of Control Room, Users need to configure the login approach. There are different approach to login.
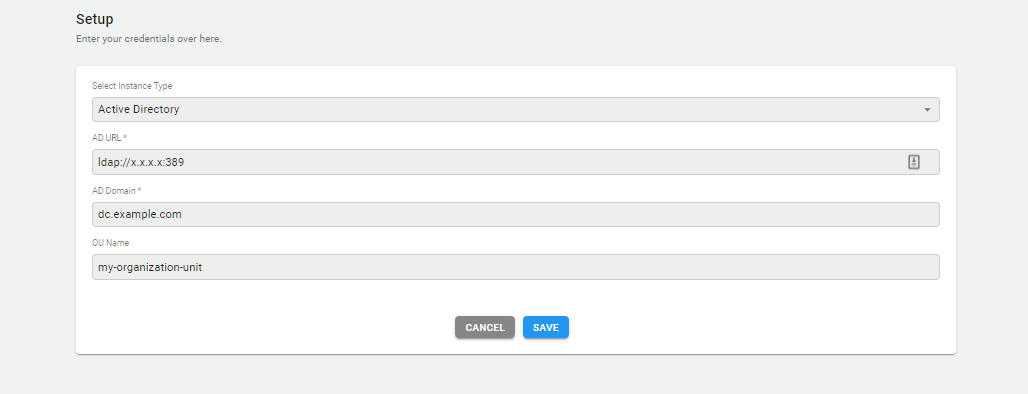
- Active Directory : In order to setup AD, please follow below steps:
-
- Select ‘Active Directory’ from the ‘Pipeline Type’ drop down.
- Enter the ldap server URL in the ‘AD URL’ field. For Eg: ldap://x.x.x.x:389
- Enter Active Directory domain name in the ‘AD Domain’ field.
- Enter organization unit name in ‘OU Name’ field.
- Hit ‘Save’
- Local : In order to login by the Users/Server local directory.
- None: Users who do not want to receive any alerts can choose none.
Alert Settings
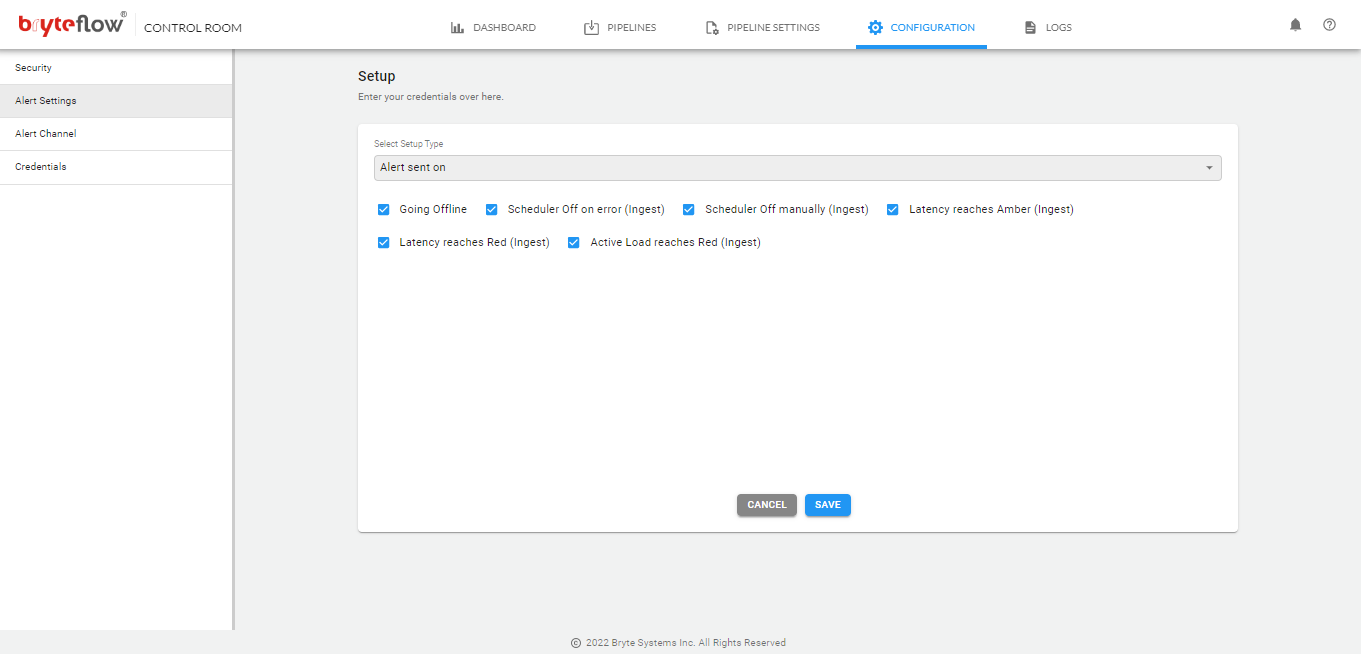
In Alert settings tab, Users can choose the Events on which alerts are sent to destined Users.
The Events on which Alerts can be sent are:
- Going Offline : Users are alerted when any of the configured pipelines goes offline.
- Scheduler Off on error(Ingest) : Users are alerted when the scheduler goes off in BryteFlow Ingest, on any error condition.
- Scheduler Off manually (Ingest) : Users are alerted when the scheduler goes off in BryteFlow Ingest, by manual action
- Latency reaches Amber(Ingest): Users are alerted when the latency limit of BryteFlow Ingest reaches Amber zone.
- Latency reaches Red(Ingest): Users are alerted when the latency limit of BryteFlow Ingest reaches Red zone.
- Active Load reaches Red(Ingest): Users are alerted when the active load is breaching the latency limits to Red Zone.
Alert Channel
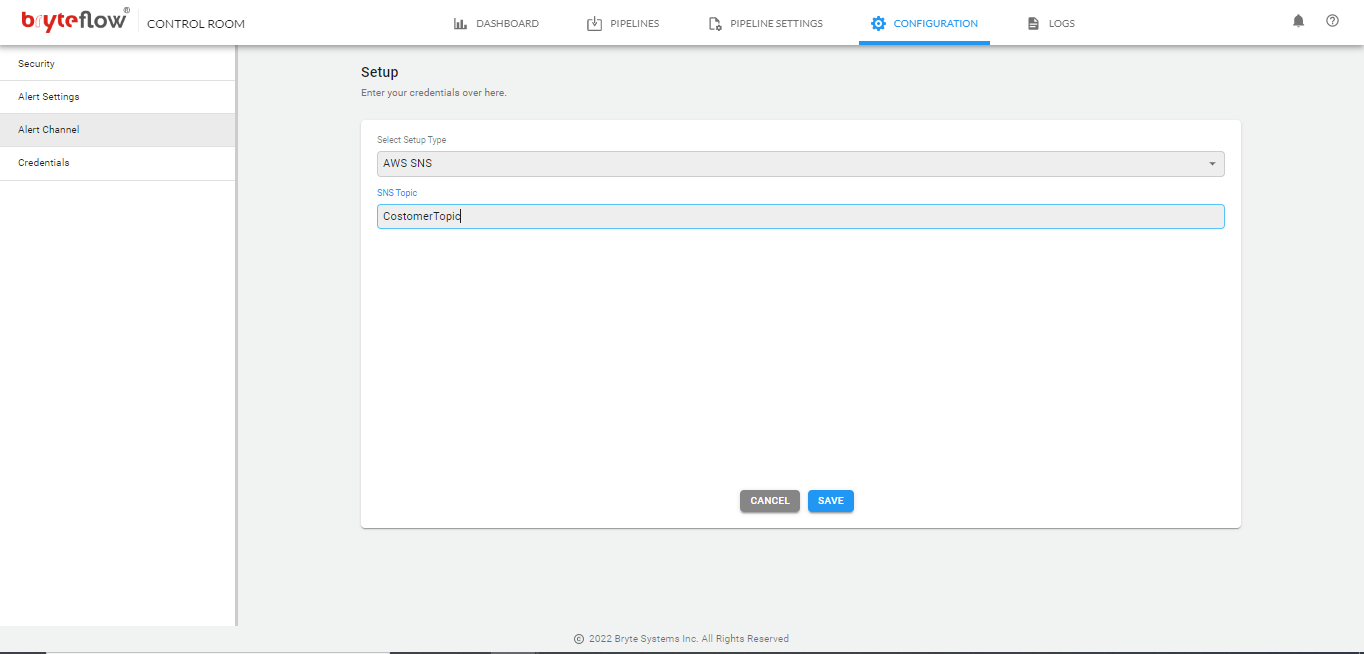
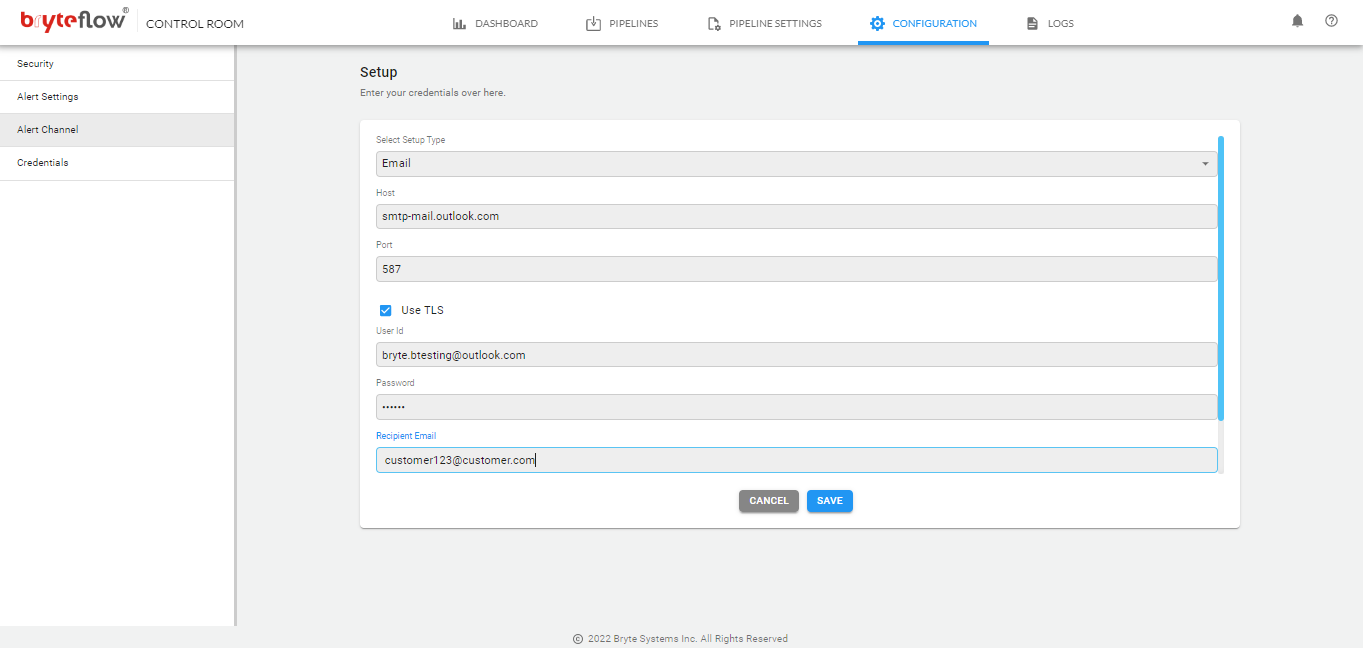
In this section, Users can configure the way in which they want to get alerted.
Different Alert channels that’s supported are:
- AWS SNS : For AWS Cloud setting, AWS SNS topic can be configured in Control Room and the subscribed users can receive alerts with their selected method(email, SMS or calls).
- Email : This is another option for the Users to receive alerts from Control Room. Users need to configure: Email SMTP Host, Port, User ID and Password, in order to get started with it.
Credentials
When setting it up in an AWS environment, from the drop-down either select AWS credentials or AWS IAM access.
For AWS Credentials, Please enter AWS Region information alongwith your AWS Account Access Key and Secret Access Key.
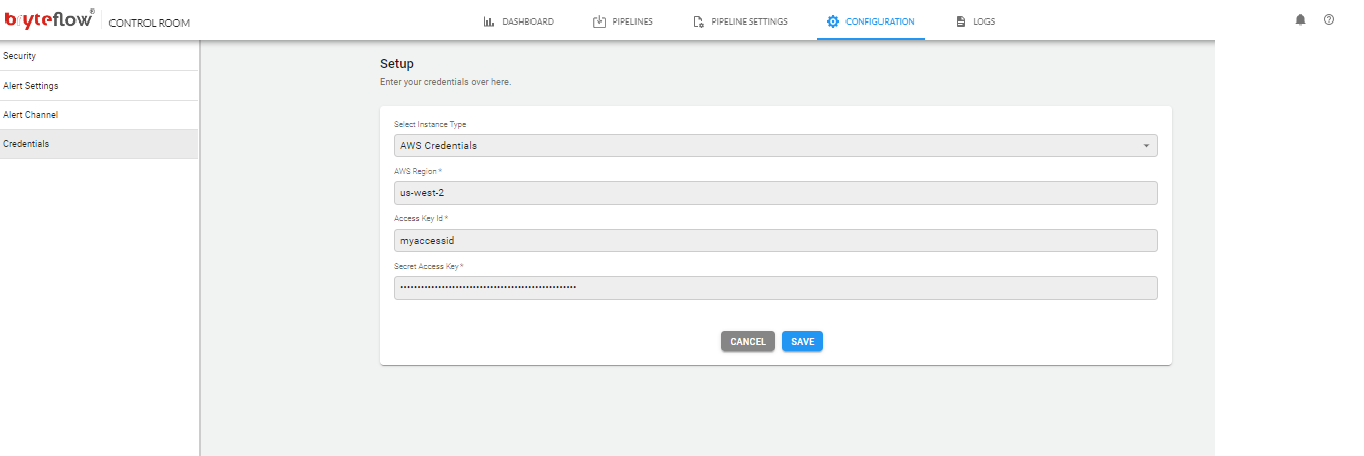
For IAM Access, Please enter AWS Region, this will use the EC2 IAM Role.
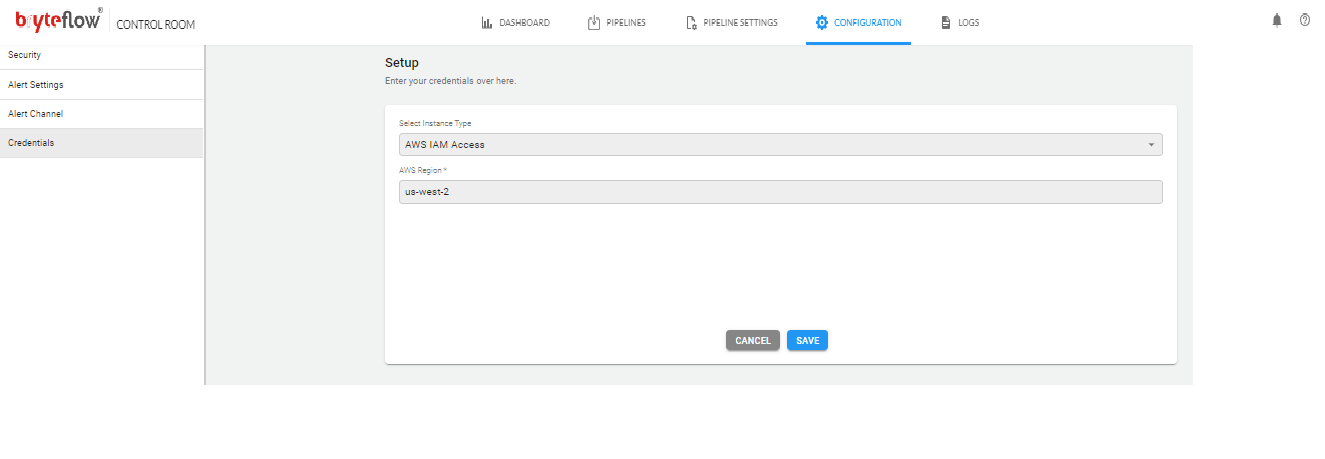
In AWS Region type in the region where the AWS Cloudwatch Logs are configured.
The region is to required to be in the standard format e.g. us-west-2.
Pipelines
The Ingest Pipelines tab lists all Ingest pipelines that have been added from the Pipeline Settings tab.
The Ingest Pipelines are listed in a tabular format. Under the Ingest Pipeline column the name is divided into two parts the first part is taken from the Name field of Ingest Pipeline tab, the second part specified in parentheses is the name given within the Ingest Pipeline.
The host column specifies the Hostname or the IP address of the server where the Ingest Pipeline is running.
The version column displays the current version and build number of Ingest and the Status column shows the current status of the Ingest pipeline. The status can have three states – OK shown as green, Idle/Halted shown as yellow, and Error/ Offline shown as red.
the extract column shows the current status of the extract and can have a value of Running or Idle. The Load column shows the current status of the load and can have values Running or Idle.
More information about tables can be viewed by clicking on the pipeline name.
Pipeline Details
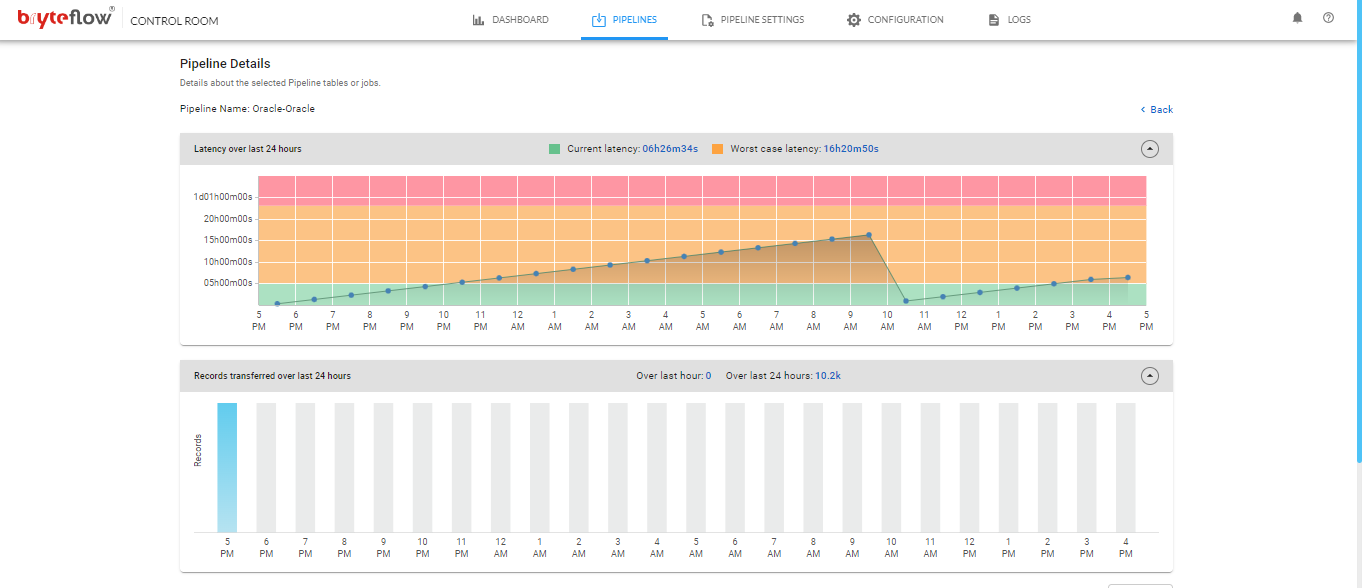
The Ingest Pipeline Details page provides more information about the tables in that Ingest Pipeline.
For each table, it shows the number of times the table has been loaded in the last 24 hours, the number of records loaded in that period and the last time the table was updated.
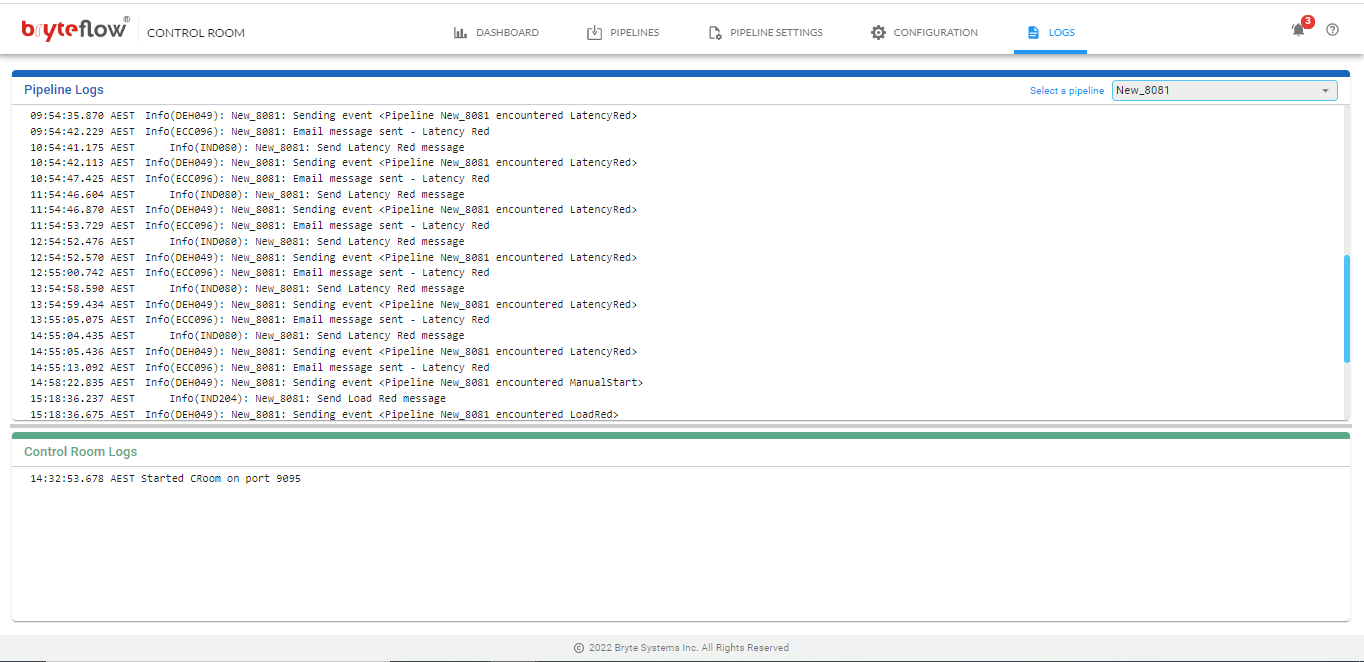
Logs
The Logs tab provided additional details of each pipeline and Control Room. It displays both Pipeline and Control Room Logs separately.
Pipeline Events are displayed by selecting the Pipeline from the available list of pipelines that have been configured in Control Room.
Control Room Logs displays the activity logs from the Control Room.
Users can now check the logs for any notification failure etc. from the log page.